
Quickly Call Java Methods
DebugTools lets you call Java methods in your project directly from IntelliJ IDEA. Both local and remote applications are supported, and you can call multiple methods across multiple applications at the same time.
You do not need to add a Controller, write a temporary test case, or trigger the logic layer by layer from a request entry point. Select the target method, fill in the parameters, and run it to quickly verify your business logic.
Use Cases
You can call ordinary class methods, static methods, Spring Bean methods, Dubbo services, XXL-JOB tasks, MQ consumer methods, MyBatis Mapper methods, streaming SSE responses, and more.
- Verify the return result of a Service, Mapper, utility class, or component method
- Skip outer flows such as Controller, gateway, authentication, and parameter assembly, and debug core business logic directly
- Quickly call Spring-managed Bean methods, including methods from frameworks such as Dubbo, XXL-JOB, and MQ
- Call MyBatis Mapper methods to verify SQL parameters, query results, and execution time
- Pass complex parameters, Header parameters, or XXL-JOB parameters to a method
- Remotely call methods in the target application and use remote Debug to locate problems
- Combine with hot reload to call the method again immediately after changing code
Quick Start
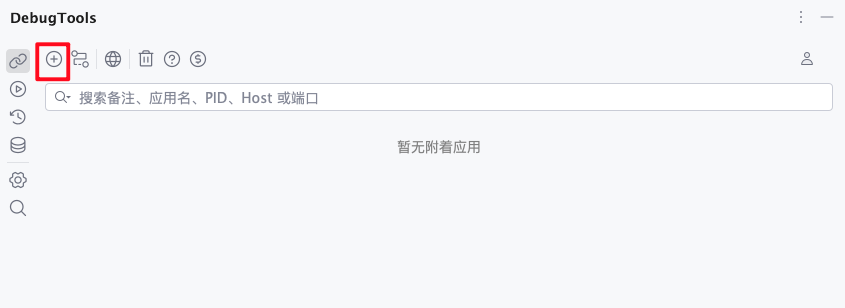
Attach an Application
Click the attach button in the toolwindow to view the applications that can currently be attached.
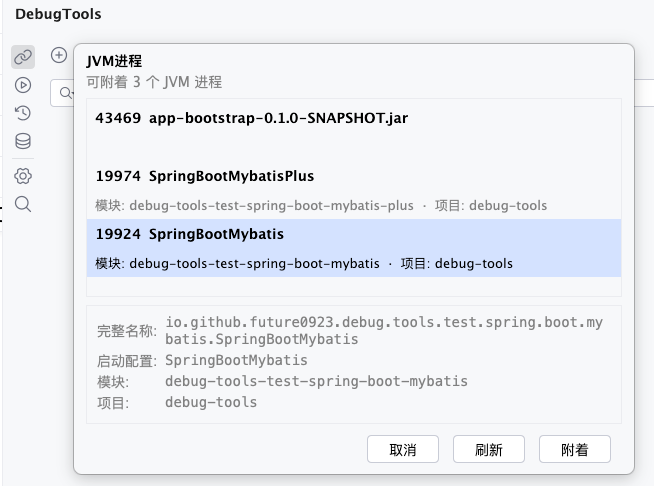
Double-click an application, or click the attach button below it, to attach the application. Click the item below to view its details.
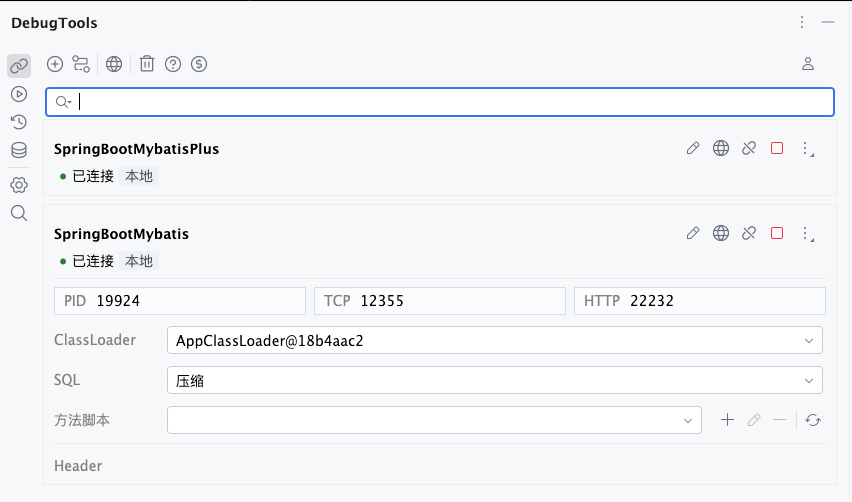
You can view attached applications in the connection management list. Multiple applications can be attached at the same time.
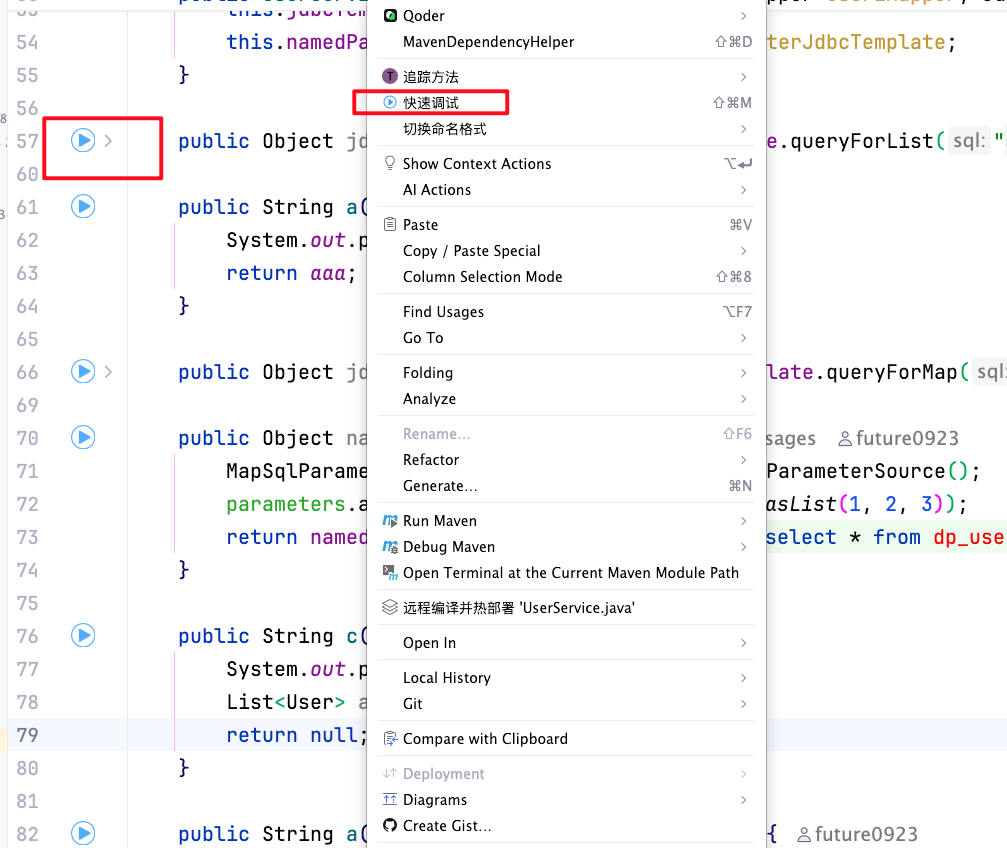
Select a Method
You can open the method invocation window from both the method gutter icon and the right-click menu inside the method body. Multiple methods are supported.
View the method invocation window in toolwindows.
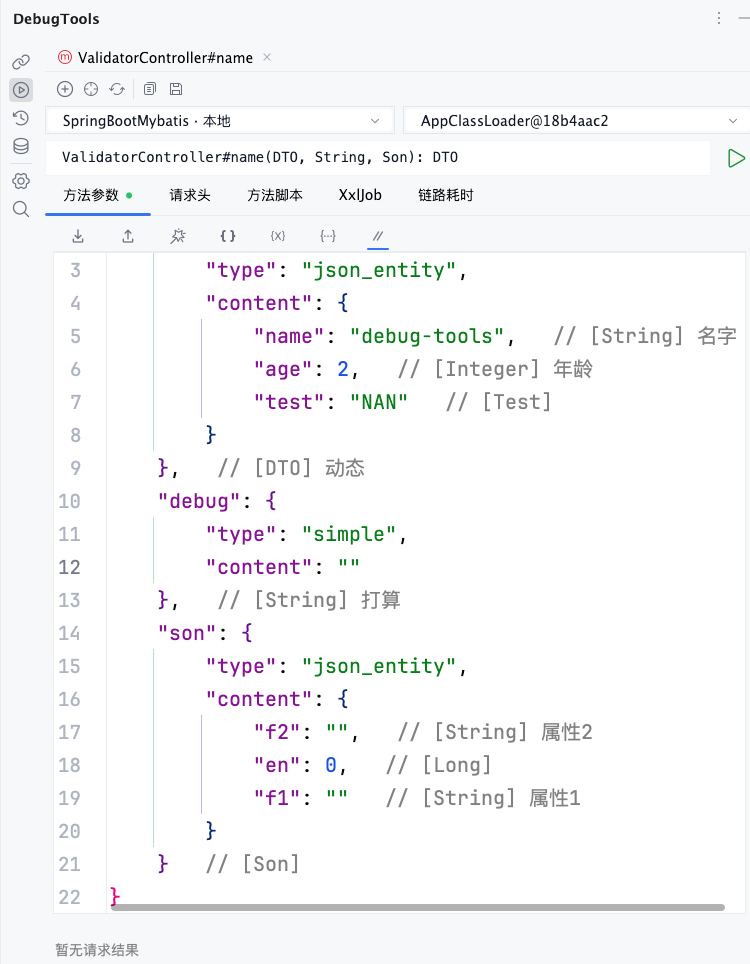
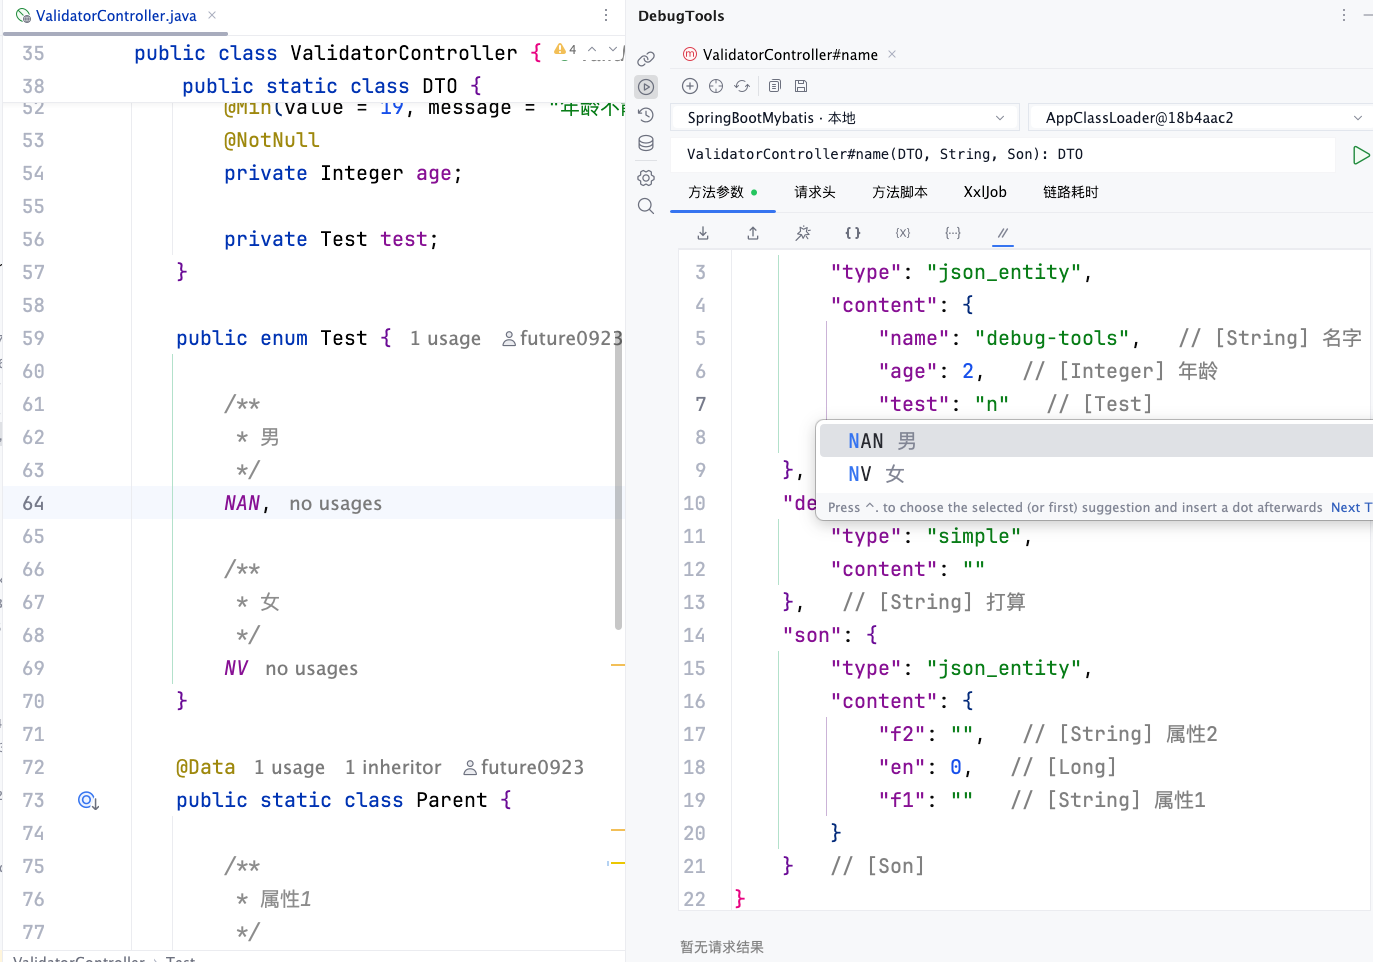
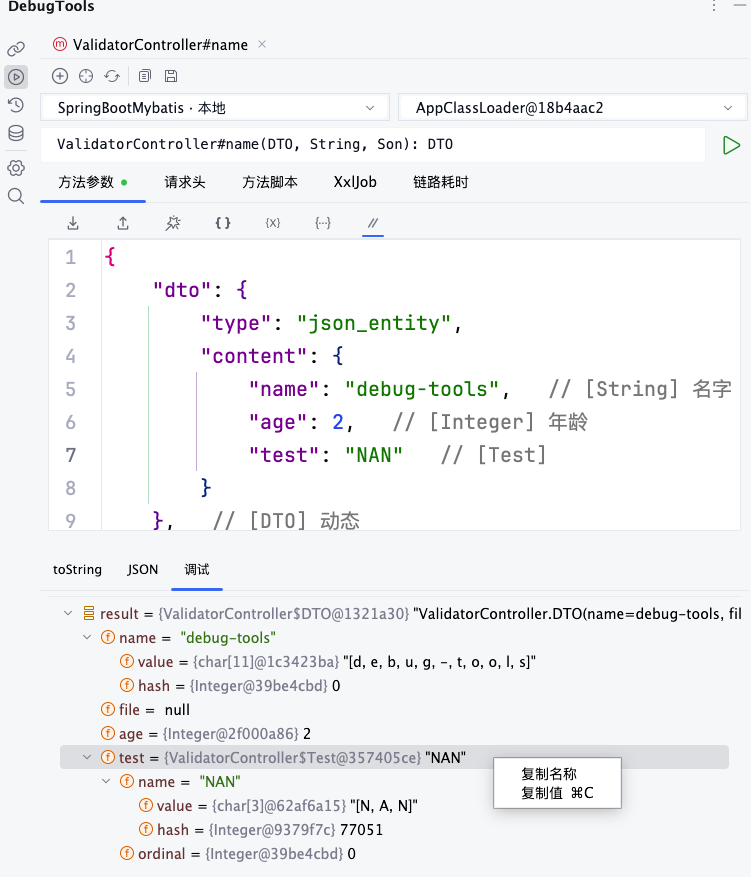
Fill In Parameters and Run
Fill in the method parameter information. Complex parameters, Header parameters, pre- and post-scripts, XXL-JOB parameters, and more are supported. Then click run.
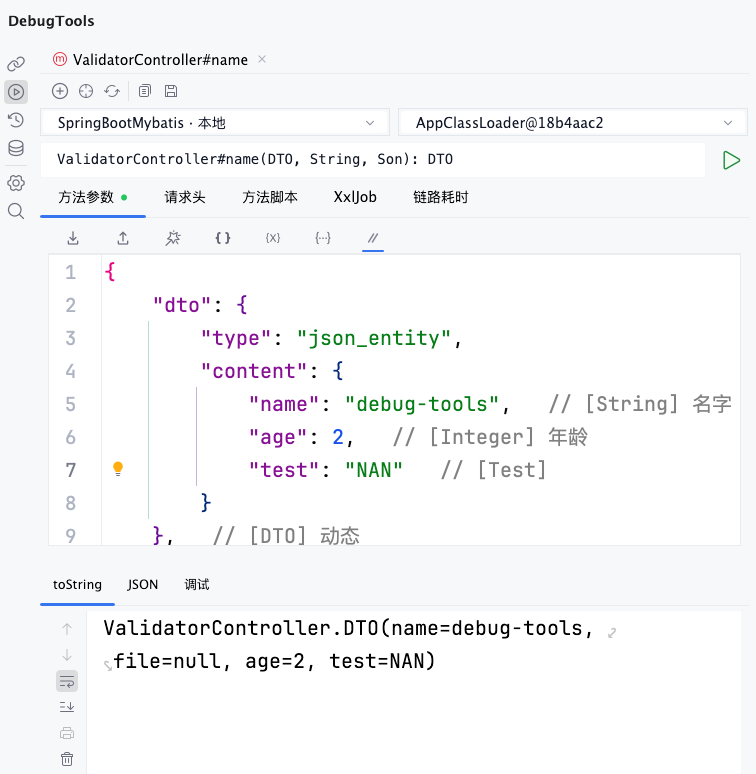
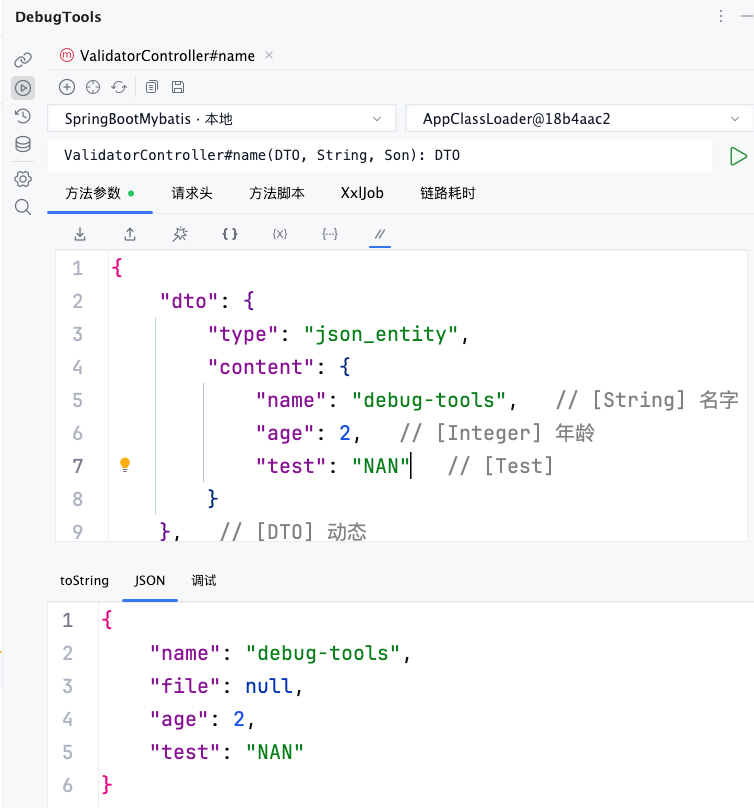
View Results
View the result with toString.
View the result as JSON.
View the result in Debug mode. The effect is basically the same as viewing breakpoints in IDEA.
TIP
There are also special result views for scenarios such as Exception, SSE streaming, and Trace. These will be introduced in detail later.