
Convert to HTTP
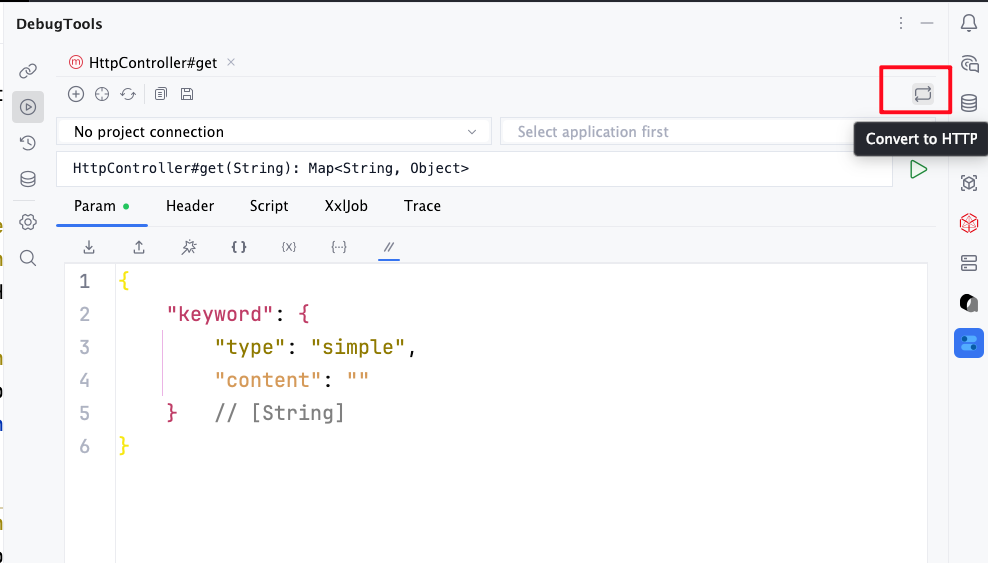
Convert to HTTP switches a Spring Controller method invocation page into a real HTTP request page.
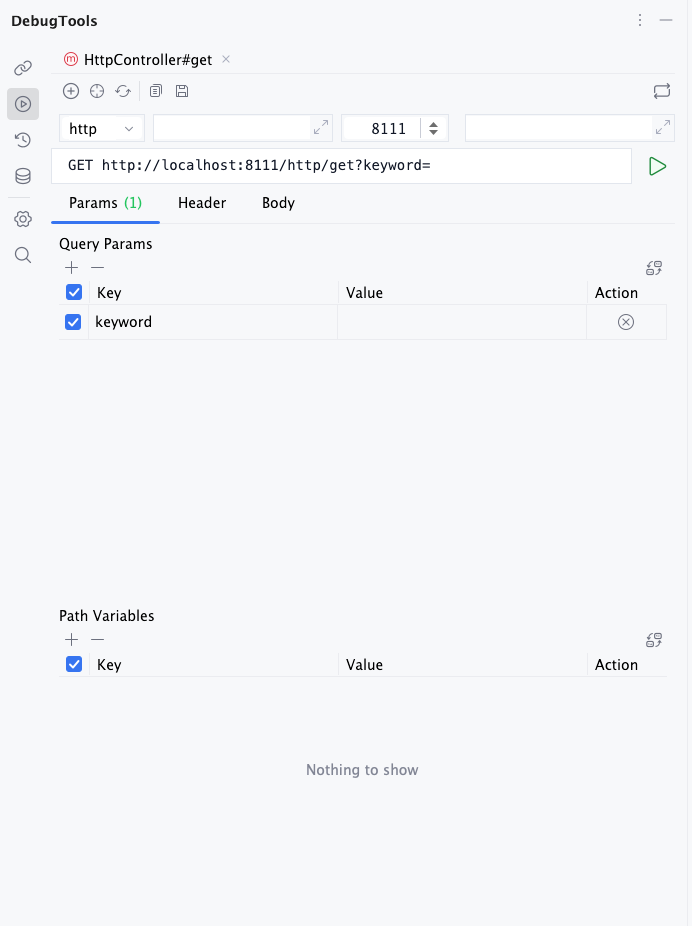
It uses the Controller mapping, current parameter JSON, and headers to generate the request URL, Query, Header, and Body, then accesses the target service through HTTP.
This is useful when you need to verify the full path from the HTTP entry point to the Controller, such as Filter and Interceptor behavior.
Open HTTP Mode
On the method invocation page, click  in the toolbar. The page switches to HTTP mode.
After conversion, the page works like a regular HTTP request tool.
TIP
- The first input is the host. The second input is the context path.
- To return to normal method invocation, click in the toolbar again.
Auto Detection
Port and Context Path
When you click , if DebugTools is already attached to the target application, it automatically reads the actual port and context path after startup.
If no application is attached, DebugTools locates the module that contains the current Controller and reads these YAML files under src/main/resources:
bootstrap.yml
bootstrap.yaml
application.yml
application.yaml
Local detection only reads server.port, server.servlet.context-path, and spring.profiles.active. After detecting spring.profiles.active, it continues reading bootstrap-{profile}.yml, bootstrap-{profile}.yaml, application-{profile}.yml, and application-{profile}.yaml in the same directory. Profile-specific configuration overrides the base configuration.
Parameter Completion and Conversion
When you click , DebugTools reads the parameter JSON in the current method invocation page Param tab and carries each parameter's content into the HTTP page.
In other words, you can generate and edit parameters in the normal method invocation page first, then convert the request to HTTP without filling the HTTP page again.
Header
Headers in HTTP mode use the same configuration model as the Headers tab on the method invocation page. Method-level, application-level, and project-level headers are supported.
See Request Headers.
Body
Body works like a normal HTTP request tool. It supports none, form-data, x-www-form-urlencoded, json, text, xml, and binary.
Send and View Results
After clicking the request button, DebugTools uses the built-in IDEA HTTP client to access the generated URL. The default timeout is 60 seconds.
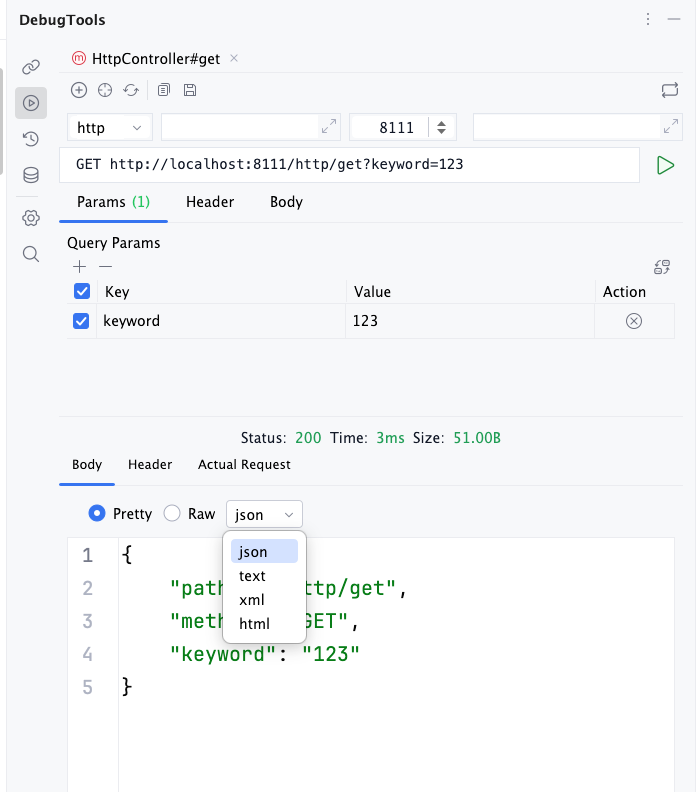
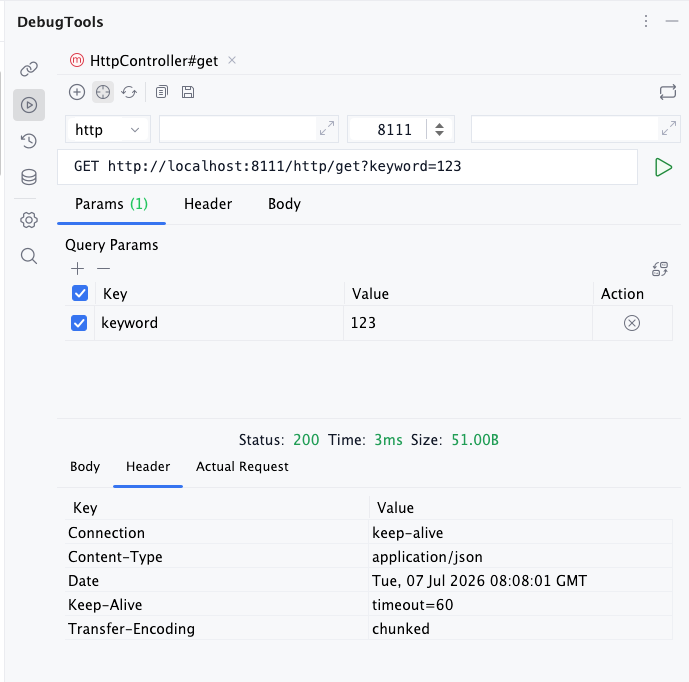
After the request completes, the result area shows Status, Time, and Size at the top, then displays response content by tabs.
The Body tab is used to view the response body. It supports formatted/raw switching, and you can choose json, text, xml, or html as the display format.
The Header tab shows response headers returned by the server.
The Actual Request tab shows the final request sent by DebugTools, including request URL, request Header, and request Body. When checking whether parameters, headers, or Content-Type are correct, start here.
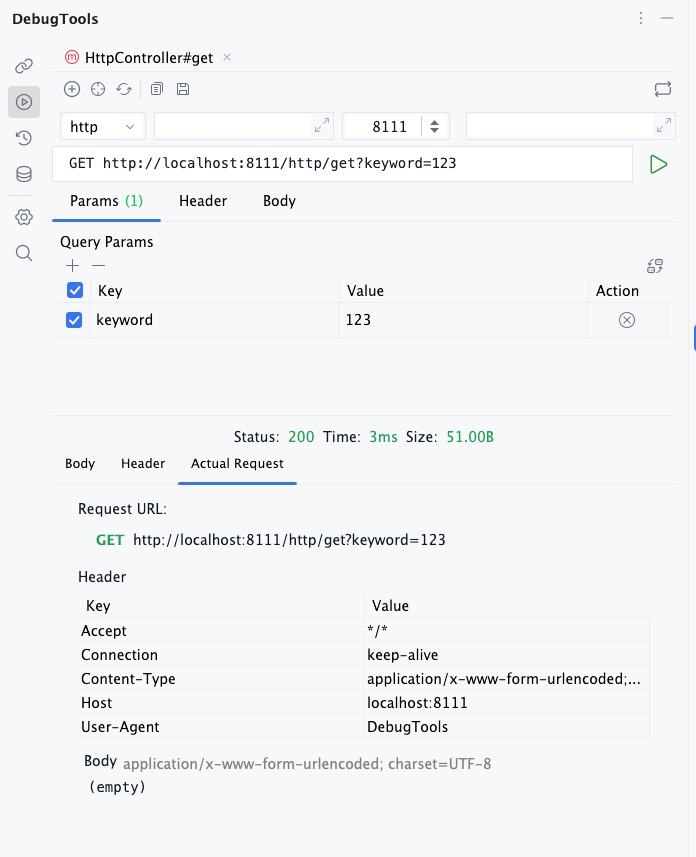
Connection failures, timeouts, certificate errors, and unreachable target services are shown in the response Body area.
Common Cases
| Symptom | What to do |
|---|---|
| is not shown | The current method has no resolvable Spring mapping, or it is not a Controller HTTP method. |
| The detected port or context path is wrong | Attach to the target application before converting. If it is still wrong, edit the address fields manually. |
The project uses application.properties | Local auto detection does not parse properties files. Prefer runtime configuration after attaching to the application. |
| File upload parameter is empty | Select a local file path for the file item in form-data. |
| POST parameters are put into Query | Normal @RequestParam values go into Query by default. To send them in a form Body, declare consumes or adjust the Body manually. |
If you only need to verify the method's internal business logic, normal Method Invocation is more direct. If you need to verify the real HTTP entry path, use Convert to HTTP.